Gold Detectors and Metal Detectors Dealer in Dubai UAE

phoenix
Phoenix metal detector
Phoenix
Device name Phoenix
Brand Mega Locators
Research System 3D image System
Surface Search Range 0 meters
Underground search Depth 40 meters
Warranty 5 years
Made in Germany
Phoenix metal detector is a 3D ground scanner

Phoenix 3D metal detector

The new Device from the Mega Detection Factory, the Phoenix metal detector is a 3D ground scanner with a completely new ground scanning technology that ensures faster and more accurate results in finding and detection of ancient treasures and burials at very great depths.

Mega Detection company provides, via Phoenix 3D ground scanner, an effective professional device with 3 search systems suitable for professional prospectors and treasure hunters looking for antiquities and gold treasures.

Phoenix provides a rich visual user experience by displaying the results of the 3D ground scan either directly on the device screen or via an Android tablet via the powerful analysis app “Multi Visual Analyzer” that provides all the tools to analyze the scan data visually.

On the other hand, although it is a device intended for professionals, the device is easy to use, thanks to its multi-language modern software program, which is carefully designed to facilitate the process of adjusting the settings and various scanning options as well as displaying the results.

  • Parts & Components
  • Search Systems

Device Components:

System Box (Main Unit)

Multi-Ground Scanner (M.G.S.60)

Vertical High Signal Transceiver: (V.S.T)

M.G.S Connector

Armrest & Shafts

Lithium-Ion Battery

Headphones

Accessories Box (Screws – Nuts – Battery Charger – Cables…)

Android Tablet (Optional)

1 – 3D Ground Scan System [GROUND SCAN]

3D ground scan system is the most powerful system for detection in Phoenix device, it is developed with a new technology incorporated in the scanner probe called Multi-Ground Scanner or M.G.S in short.

M.G.S with its unique design and large surface with multiple sensors, enable coverage and scanning of larger area in less time but with more accurate results.

3D ground scan system displays the scanning data obtained from M.G.S as 2D visualization on the device screen or as 3D graphics presentation on bundled Android Tablet via Multi Visual Analyzer app as we will explain later.

After selecting the system from the main menu, the device program allowing the user to choose how to display the scan results. There are two options:

1 – Device

This option if selected enable the user to complete the 3D ground scan process using the device LCD screen as the results will display directly on the screen, before that the user must adjust the ground scan settings that include the following options:

  • Mode

This option defines the method for conducting the ground scan, meaning how the measurements will be recorded at each scan point.

Here there are two modes:

  1. Manual: in manual mode, the recording of scan measurement performed manually by the user using the red button in the main unit of the device.
  2. Automatic: in this mode, the device is responsible for taking measuring points automatically
  • Path

It expresses the shape of the user’s movement path when conducting a ground scan, there are two types:

  1. One Direction: In this case, the scan points are recorded in each scan line in one direction. In other words, the direction of measurements recording is in a specific direction in each scan line, for example, starting from the south towards the north, and so on for each line, meaning that the start points of the scan lines are on the same side.
  2. Zig Zag: here the direction of measurements recording in two consecutive scan lines are in opposite directions, meaning that the start points of two consecutive scan lines are on the opposite’s sides.
  • Size

It is a dimension of a virtual scanning grid made up of cells, related to the number of scan lines and points in each scan line.

It includes the following two values:

  1. Width: it is the width or number of columns in the grid, it same as the scan line count.
  2. Height: it is the height or number of rows in the grid, it equal to the number of scan points
  • Start Point

It is the starting point for a ground scan within the pre-defined area, and one of the following two options can be chosen:

  1. Left: in this case, the scan process starts from the bottom – left corner of the scan area
  2. Right: the ground scan will begin from the bottom – right corner of the area

After setting the previously explained ground scan settings, the Scan tab displays a table summarizing the selected settings with a button to start scanning, and the user can press the OK button to actually start the scanning process and record the results.

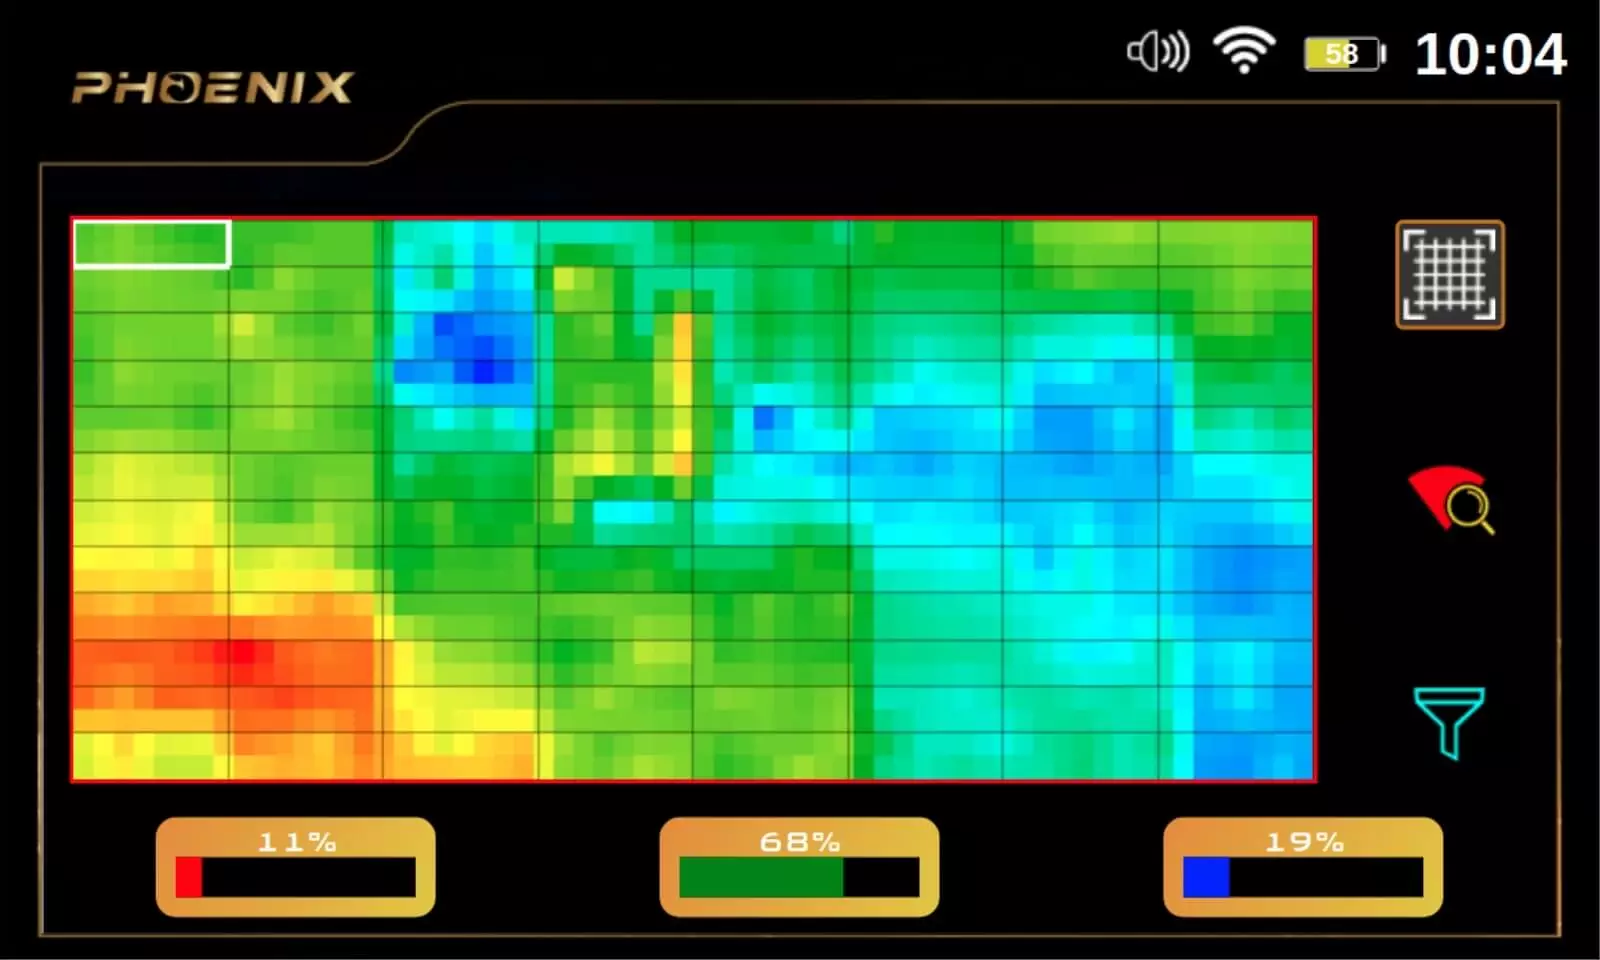
During the scan process, the measurement in every scan point will be presented visually on screen as a 2D grid consisting of rows and columns of cells and every scan point presented as a cell with 4 sub-cells in specific colors based on the type of target that M.G.S hover in this point.

The table below shows the type of target for each color:

Green Light Blue Blue Yellow Red
Normal Ground Small Cavity Cavity metal objects gold

On the left side of the screen near the grid, there are many values presented:

– Current X: it presents the current scan line number or current column number in the grid.

– Current Y: it presents the current scan point or current row number in the grid.

– Value: a numeric value related to measurement in the current scan point.

2 – Tablet

If the user selected this option on the device screen, first he must make a wireless connection between the device and tablet, he must continue the 3D ground scan on the bundled Android tablet.

In this case, the user chooses the same ground scan settings as explained previously, but inside the Multi Visual Analyzer app and the ground scan data visualized as 3D graphics inside the app.

Multi Visual Analyzer app can be installed on any Android tablet or smartphone, it has a simple graphical interface available in 12 languages, it used to adjust settings of ground scan and scan data transmitted in real-time from M.G.S to be presented as 3D graphics with different colors that refer to various target’s types such as metal, cavity or gold like in the previous table.

2 – Live Stream System [LIVE STREAM]

Live Stream scan system is powerful ground scan mode with a live real-time scan of the ground and direct visualization of measurement on a display screen or optionally on the tablet via Multi Visual Analyzer.

The scanning process in this system is carried out by a Vertical High Signal Transceiver (V.S.T) probe, a new probe with unique technology to perform a deep live scans to detect different types of targets including ferrous metal, non-ferrous metal, and cavities like tunnels or caves.

V.S.T is installed in front of Phoenix main unit and must be vertical, it must always be perpendicular to the ground during the scanning process.

At the end of the probe, there is a four-sided cone with two sides containing a set of luminous LEDs, whose colors change during the scanning process according to the target type.

For example: When a user moves a V.S.T probe over a golden object like a golden coin the LEDs will light up in red color, it will light up in blue when V.S.T passes over a cavity.

After selecting the Live Stream system from the main menu, the screen displays a screen to calibrate the V.S.T probe first, then move directly to the live-stream screen that displays a continuous stream of colors changing during scan made by V.S.T based on target type in a similar way as explained for LEDs, on the right of the screen a numerical value of target displayed, the user here can change the speed of the stream.

For example: color is Red when capturing a precious metal signal and green for normal ground.

Users can also display live-stream visualization on tablets via Multi Visual Analyzer, in this case, they must connect the device and tablet via Bluetooth, and selecting Live Stream inside the app.

The multi Visual Analyzer app will display a changed-color stream of received scan data from V.S.T, here also the colors related to the target type in the same way.

3 – Pin Pointer System [PINPOINTER]

The Pen Pointer system is a system usually used after excavation in order to accurately locate a potential target.

The scan process is carried out here via a V.S.T probe also, and in a similar way to the live stream system, where the probe must be perpendicular to the ground as well.

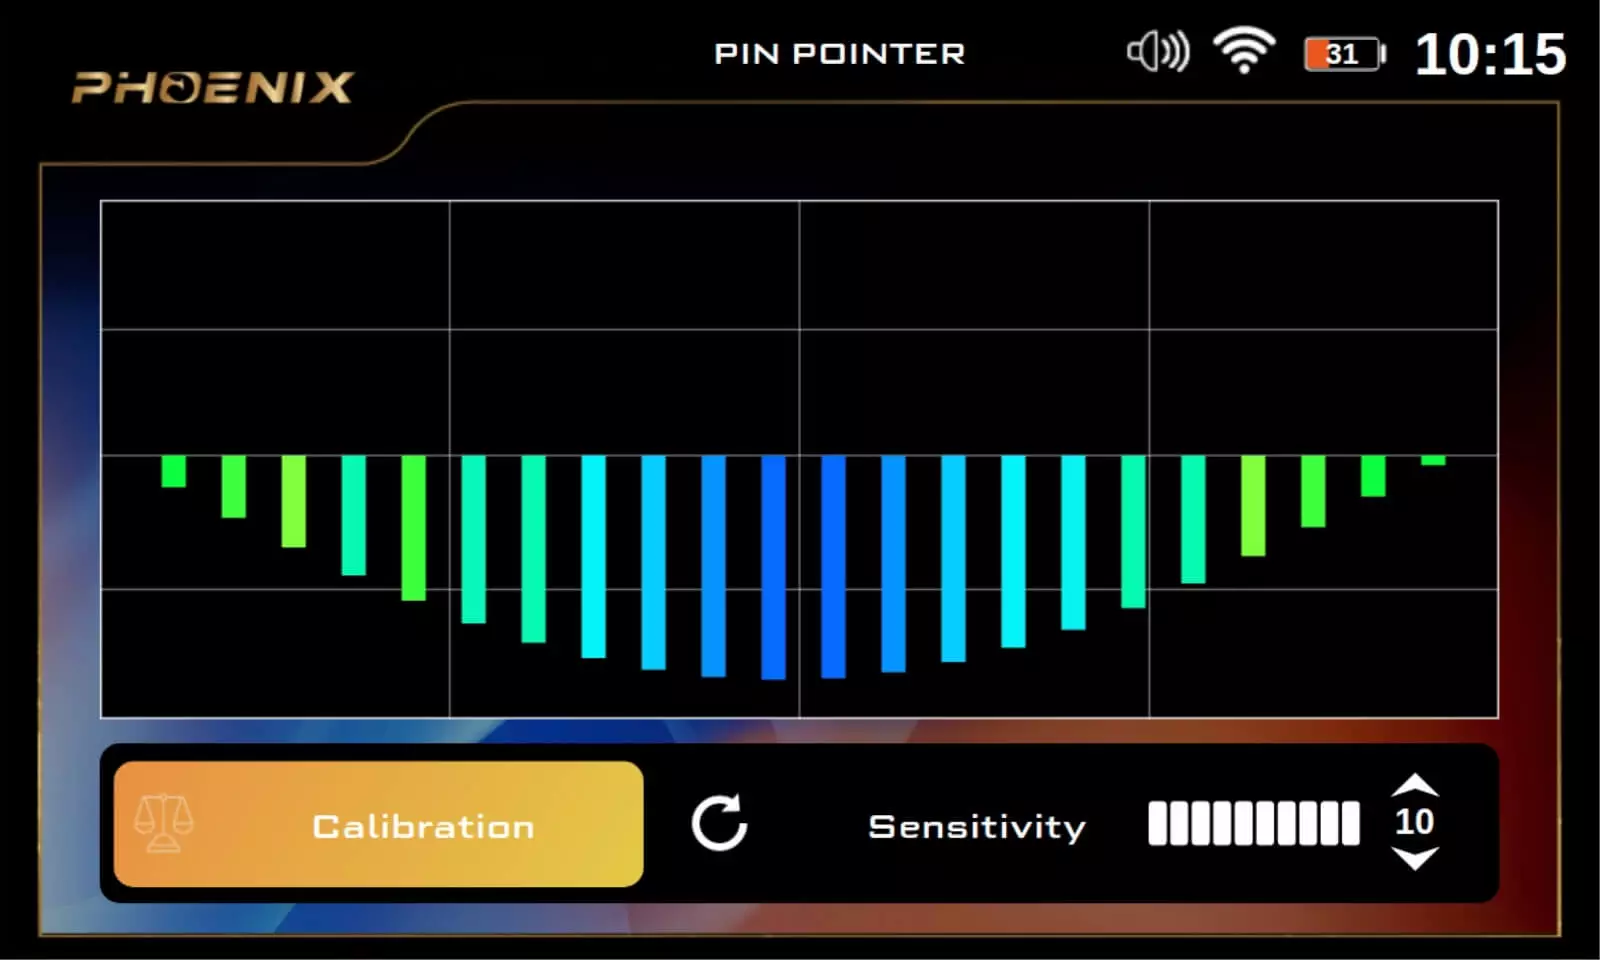
Pen Pointer is used to determine the presence of a metal target or cavity with the precise determination of the location in which the buried metal or cavity is located via audio feedback or visualization on screen as a 2D bar graph.

In the result screen there are many settings that users can adjust:

  • Sensitivity

The sensitivity value is related to adjusting the sensitivity of the captured signal through the V.S.T probe, according to this value, the visual representation of the signals and the tone of the audio output changes.

  • Calibration

Users can use this option to calibrate the sensor sensitivity at any time according to the ground type and the ground state.

  • Reset

This option reset the calibration process to its default value.

The visual representation of received signals on the device screen is a 2D bar graph.

In case of signals of the metallic target such as bronze statue, for example, the bar graph will be consisting of bars facing upward, of different lengths, with graded colors from green to red in the middle at the maximum values, and then graded towards green on sides.

If received signals are for cavities – such as a tunnel – it will be made of bars facing downwards, of different lengths, ranging from green to dark blue in the middle at the maximum values, and then graded towards green at lower values.